Choosing an analytics & reporting platform has never been harder than it is today. Tableau, PowerBI, and Google Data Studio are just a few of the popular tools in the market. There are hundreds more including QLik, Sisense, Looker, and Domo. With so many options, how do you pick the right platform for your needs? Here are a few factors to guide you to a good choice for you:
1. Quality : Are you looking for a quick prototype or do you need a tool with presentation quality reports ?
2. Price: How much are you willing to pay for an analytics & reporting solution ? Most tools offer a monthly payment option.
3. Privacy: Do you have data that cannot leave your company network ? This can lead you to an on-premise or a cloud-based tool.
4. Features: What are the must have features you need in the platform? Some examples:
– Drill down
– export to PDF, PPT
– a white-labeled portal to view your reports
– Automated report emails
5. Access to the tool: Do you need to restrict access to certain reports and certain members of your team? Do you need the reports embedded into your company website?
6. 3rd party data integrations: Do you need to get data from SalesForce, QuickBooks, Shopify, Google Analytics and other platforms ?
7. Customization: Do you have the tech resources to manage & customize the platform you decide on? This can lead you to a commercial or open source tool.
In our next post, we’ll provide a side-by-side comparison of the top 15 analytics & reporting tools in the market based on the above factors.
Have a question or a comment? Get in touch at info@dataclariti.com.
#BI #businessintelligence #dataanalysis #dataviz #datavisualization #analytics
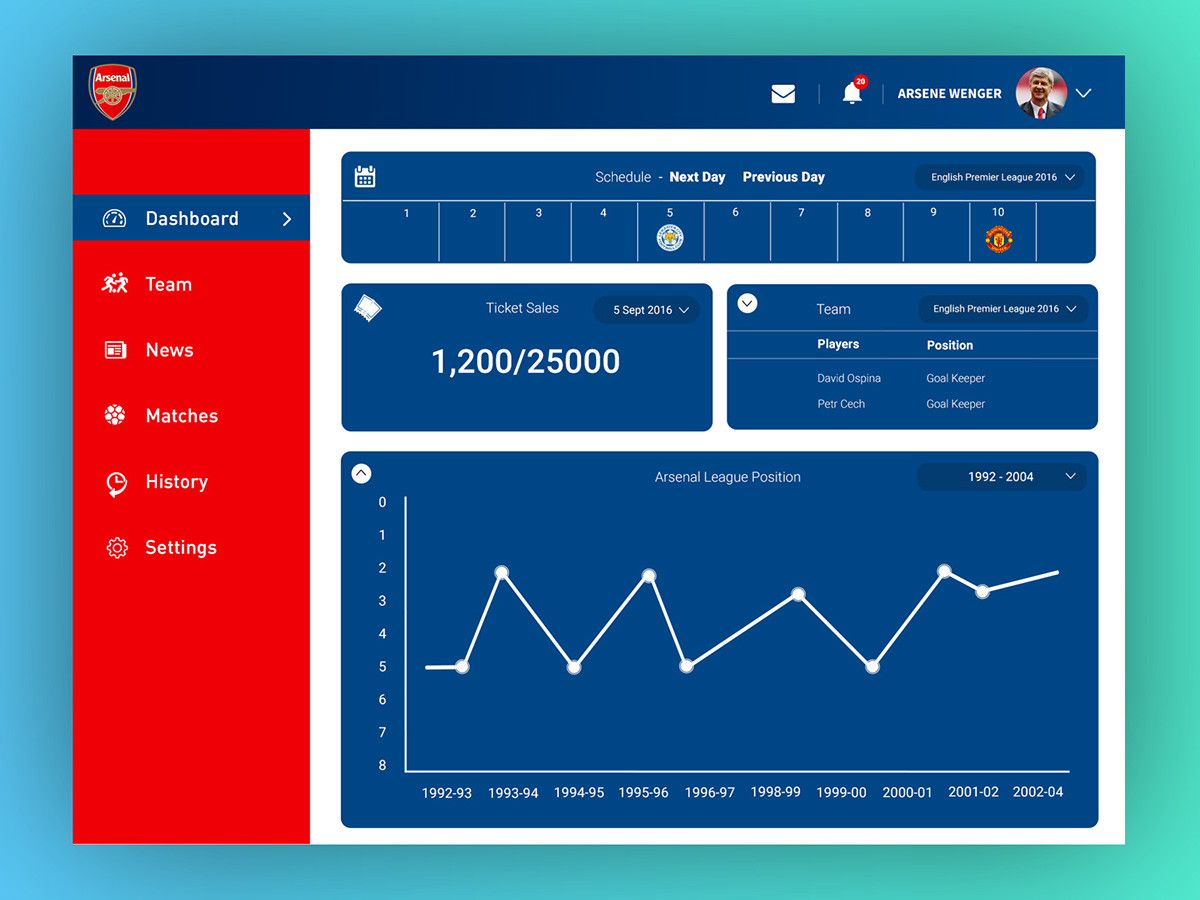
“#DailyUi 018 -Analytics Chart” by Mohammed Gaus Shaikh is licensed under CC BY-NC-ND 4.0


